| Mean Household Income of Quintiles, 2021 | ||||||
|---|---|---|---|---|---|---|
| Seven Representative U.S. States | ||||||
| lowest | second | third | fourth | highest | top 5% | |
| District of Columbia | $12,971 | $51,060 | $94,478 | $157,803 | $375,792 | $670,768 |
| Massachusetts | $16,812 | $50,519 | $89,602 | $142,491 | $316,447 | $558,616 |
| California | $17,433 | $49,234 | $84,658 | $134,560 | $309,857 | $555,007 |
| North Carolina | $13,880 | $36,395 | $60,870 | $95,946 | $217,348 | $390,822 |
| Ohio | $13,962 | $37,248 | $62,197 | $96,445 | $209,247 | $370,964 |
| Maine | $14,836 | $38,190 | $63,621 | $97,559 | $205,365 | $359,776 |
| Puerto Rico | $2,906 | $12,144 | $22,163 | $38,397 | $99,043 | $187,234 |
Source: US Census Bureau, American Community Survey |
||||||
Making Tables
September 17, 2026
Why Tables?
- Summary statistics
- Precise values (for small number of cases)
- Regression tables
Awesome Table
When Not to Use Tables?
- To show a trend
- Display a relationship
- Lots of values
- Few values but column chart is better
The Grammar of Tables
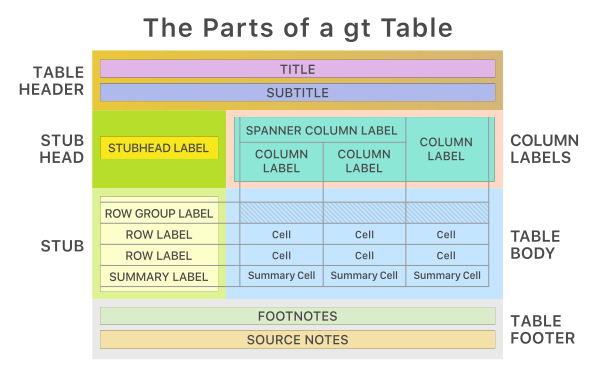
Prep
- Do the prework for the module
- Get a census API key
Set API key
Load Variables
Search for “quintile”…
Clean the Data
library(stringr)
library(dplyr)

quintiles <- get_acs(geography = "state",
                      variables = c(q1 = "B19081_001",
                                    q2 = "B19081_002",
                                    q3 = "B19081_003",
                                    q4 = "B19081_004",
                                    q5 = "B19081_005",
                                    top5 = "B19081_006"),
                      year = 2021,
                      output = "wide") |>
                      select(
                        !ends_with("M"), # eliminate margin of error
                        -GEOID) |> # eliminate geo id
                      rename(name = NAME) |>
                      rename_with(~str_remove(., 'E'))


glimpse(quintiles)10:00
kableExtra Table
| name | q1 | q2 | q3 | q4 | q5 | top5 |
|---|---|---|---|---|---|---|
| District of Columbia | 12971 | 51060 | 94478 | 157803 | 375792 | 670768 |
| Connecticut | 17417 | 48870 | 84042 | 133488 | 319533 | 602707 |
| New York | 14054 | 42220 | 75647 | 123318 | 302676 | 574063 |
| New Jersey | 18458 | 52339 | 90337 | 142858 | 319140 | 562886 |
| Massachusetts | 16812 | 50519 | 89602 | 142491 | 316447 | 558616 |
| California | 17433 | 49234 | 84658 | 134560 | 309857 | 555007 |
| Maryland | 19946 | 55165 | 91725 | 140353 | 293979 | 503597 |
| Washington | 19367 | 50803 | 82817 | 127003 | 277165 | 487950 |
| Virginia | 17922 | 48359 | 81072 | 127411 | 280299 | 486006 |
| Illinois | 15102 | 42688 | 72900 | 114531 | 258373 | 466713 |
kableExtra Table
Issues with this table?
| name | q1 | q2 | q3 | q4 | q5 | top5 |
|---|---|---|---|---|---|---|
| District of Columbia | 12971 | 51060 | 94478 | 157803 | 375792 | 670768 |
| Connecticut | 17417 | 48870 | 84042 | 133488 | 319533 | 602707 |
| New York | 14054 | 42220 | 75647 | 123318 | 302676 | 574063 |
| New Jersey | 18458 | 52339 | 90337 | 142858 | 319140 | 562886 |
| Massachusetts | 16812 | 50519 | 89602 | 142491 | 316447 | 558616 |
| California | 17433 | 49234 | 84658 | 134560 | 309857 | 555007 |
| Maryland | 19946 | 55165 | 91725 | 140353 | 293979 | 503597 |
| Washington | 19367 | 50803 | 82817 | 127003 | 277165 | 487950 |
| Virginia | 17922 | 48359 | 81072 | 127411 | 280299 | 486006 |
| Illinois | 15102 | 42688 | 72900 | 114531 | 258373 | 466713 |
Let’s make a gt table
Create states data frame…
05:00
Let’s make a gt table
| name | q1 | q2 | q3 | q4 | q5 | top5 |
|---|---|---|---|---|---|---|
| District of Columbia | 12971 | 51060 | 94478 | 157803 | 375792 | 670768 |
| Massachusetts | 16812 | 50519 | 89602 | 142491 | 316447 | 558616 |
| California | 17433 | 49234 | 84658 | 134560 | 309857 | 555007 |
| North Carolina | 13880 | 36395 | 60870 | 95946 | 217348 | 390822 |
| Ohio | 13962 | 37248 | 62197 | 96445 | 209247 | 370964 |
| Maine | 14836 | 38190 | 63621 | 97559 | 205365 | 359776 |
| Puerto Rico | 2906 | 12144 | 22163 | 38397 | 99043 | 187234 |
Let’s make a good gt table
| Mean Household Income of Quintiles, 2021 | ||||||
|---|---|---|---|---|---|---|
| Seven Representative U.S. States | ||||||
| lowest | second | third | fourth | highest | top 5% | |
| District of Columbia | $12,971 | $51,060 | $94,478 | $157,803 | $375,792 | $670,768 |
| Massachusetts | $16,812 | $50,519 | $89,602 | $142,491 | $316,447 | $558,616 |
| California | $17,433 | $49,234 | $84,658 | $134,560 | $309,857 | $555,007 |
| North Carolina | $13,880 | $36,395 | $60,870 | $95,946 | $217,348 | $390,822 |
| Ohio | $13,962 | $37,248 | $62,197 | $96,445 | $209,247 | $370,964 |
| Maine | $14,836 | $38,190 | $63,621 | $97,559 | $205,365 | $359,776 |
| Puerto Rico | $2,906 | $12,144 | $22,163 | $38,397 | $99,043 | $187,234 |
Source: US Census Bureau, American Community Survey |
||||||
Let’s make a good gt table
goodtable <- gt(states) |>
  tab_header(
    title = "Mean Household Income of Quintiles, 2021",
    subtitle = "Seven Representative U.S. States"
  ) |>
  cols_label(
    name = "",
    q1 = "lowest",
    q2 = "second",
    q3 = "third",
    q4 = "fourth",
    q5 = "highest",
    top5 = "top 5%"
  ) |>
  fmt_currency(
    columns = c(q1:top5),
    currency = "USD",
    use_subunits = FALSE
  ) |>
  # note that you can use markdown (md) to format the source note for html documents
  tab_source_note(source_note = md("**Source**: US Census Bureau, American Community Survey"))

goodtable10:00
Change Colum Width
| Mean Household Income of Quintiles, 2021 | ||||||
|---|---|---|---|---|---|---|
| Seven Representative U.S. States | ||||||
| lowest | second | third | fourth | highest | top 5% | |
| District of Columbia | $12,971 | $51,060 | $94,478 | $157,803 | $375,792 | $670,768 |
| Massachusetts | $16,812 | $50,519 | $89,602 | $142,491 | $316,447 | $558,616 |
| California | $17,433 | $49,234 | $84,658 | $134,560 | $309,857 | $555,007 |
| North Carolina | $13,880 | $36,395 | $60,870 | $95,946 | $217,348 | $390,822 |
| Ohio | $13,962 | $37,248 | $62,197 | $96,445 | $209,247 | $370,964 |
| Maine | $14,836 | $38,190 | $63,621 | $97,559 | $205,365 | $359,776 |
| Puerto Rico | $2,906 | $12,144 | $22,163 | $38,397 | $99,043 | $187,234 |
Source: US Census Bureau, American Community Survey |
||||||
Change Colum Width
Change Font
| Mean Household Income of Quintiles, 2021 | ||||||
|---|---|---|---|---|---|---|
| Seven Representative U.S. States | ||||||
| lowest | second | third | fourth | highest | top 5% | |
| District of Columbia | $12,971 | $51,060 | $94,478 | $157,803 | $375,792 | $670,768 |
| Massachusetts | $16,812 | $50,519 | $89,602 | $142,491 | $316,447 | $558,616 |
| California | $17,433 | $49,234 | $84,658 | $134,560 | $309,857 | $555,007 |
| North Carolina | $13,880 | $36,395 | $60,870 | $95,946 | $217,348 | $390,822 |
| Ohio | $13,962 | $37,248 | $62,197 | $96,445 | $209,247 | $370,964 |
| Maine | $14,836 | $38,190 | $63,621 | $97,559 | $205,365 | $359,776 |
| Puerto Rico | $2,906 | $12,144 | $22,163 | $38,397 | $99,043 | $187,234 |
Source: US Census Bureau, American Community Survey |
||||||
Change Font
Center
| Mean Household Income of Quintiles, 2021 | ||||||
|---|---|---|---|---|---|---|
| Seven Representative U.S. States | ||||||
| lowest | second | third | fourth | highest | top 5% | |
| District of Columbia | $12,971 | $51,060 | $94,478 | $157,803 | $375,792 | $670,768 |
| Massachusetts | $16,812 | $50,519 | $89,602 | $142,491 | $316,447 | $558,616 |
| California | $17,433 | $49,234 | $84,658 | $134,560 | $309,857 | $555,007 |
| North Carolina | $13,880 | $36,395 | $60,870 | $95,946 | $217,348 | $390,822 |
| Ohio | $13,962 | $37,248 | $62,197 | $96,445 | $209,247 | $370,964 |
| Maine | $14,836 | $38,190 | $63,621 | $97,559 | $205,365 | $359,776 |
| Puerto Rico | $2,906 | $12,144 | $22,163 | $38,397 | $99,043 | $187,234 |
Source: US Census Bureau, American Community Survey |
||||||
Center
Add Borders and Lines
| Mean Household Income of Quintiles, 2021 | ||||||
|---|---|---|---|---|---|---|
| Seven Representative U.S. States | ||||||
| lowest | second | third | fourth | highest | top 5% | |
| District of Columbia | $12,971 | $51,060 | $94,478 | $157,803 | $375,792 | $670,768 |
| Massachusetts | $16,812 | $50,519 | $89,602 | $142,491 | $316,447 | $558,616 |
| California | $17,433 | $49,234 | $84,658 | $134,560 | $309,857 | $555,007 |
| North Carolina | $13,880 | $36,395 | $60,870 | $95,946 | $217,348 | $390,822 |
| Ohio | $13,962 | $37,248 | $62,197 | $96,445 | $209,247 | $370,964 |
| Maine | $14,836 | $38,190 | $63,621 | $97,559 | $205,365 | $359,776 |
| Puerto Rico | $2,906 | $12,144 | $22,163 | $38,397 | $99,043 | $187,234 |
Source: US Census Bureau, American Community Survey |
||||||