Advanced Table Skills
September 17, 2026
gtExtras
The gtExtras package
- By now we know the difference between a graph and a table
- Tables are good for comparing individual values
- Graphs are for visualizing a whole bunch of values
- Usually we keep our graphs and tables separate
- But are there times when we might want to combine them?
gtExtraslets us include sparklines, histograms, etc. in our tables
Democracy Example
Democracy Example
Democracy Example
Your Turn!
- Download democracy data for one year
- Indicator is your choice
- Add region codes
- Group and summarize by region
- Add an appropriate inline plot to your table
15:00
When Not to Use a Table
Not a Good Table
| name | estimate | lower_90 | upper_90 |
|---|---|---|---|
| Barnstable | 40442 | 39554 | 41330 |
| Berkshire | 33040 | 32074 | 34006 |
| Bristol | 36910 | 36347 | 37473 |
| Dukes | 40119 | 34791 | 45447 |
| Essex | 39756 | 39174 | 40338 |
| Franklin | 34775 | 33712 | 35838 |
| Hampden | 32262 | 31707 | 32817 |
| Hampshire | 30795 | 29868 | 31722 |
| Middlesex | 51808 | 51337 | 52279 |
| Nantucket | 45717 | 38260 | 53174 |
| Norfolk | 52591 | 51991 | 53191 |
| Plymouth | 43684 | 43014 | 44354 |
| Suffolk | 39200 | 38624 | 39776 |
| Worcester | 39009 | 38454 | 39564 |
Use Confidence Intervals Instead
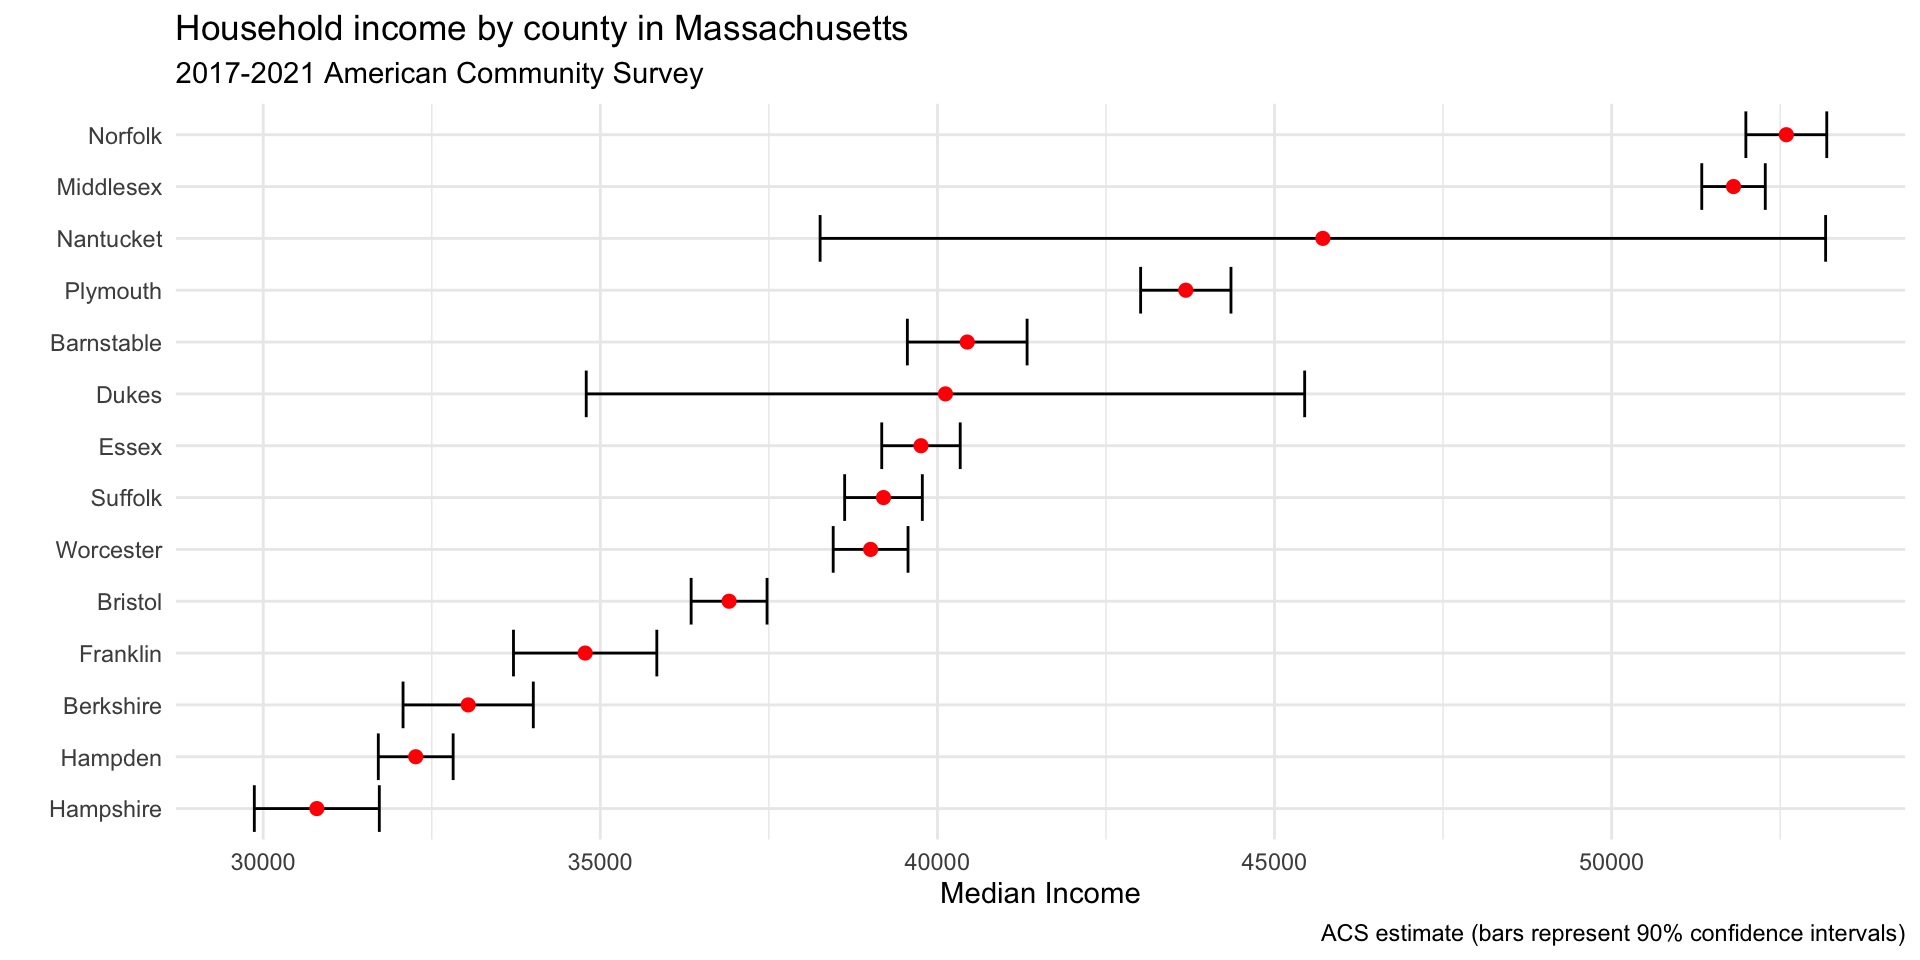
Use Confidence Intervals Instead
library(ggplot2)

mass_med_inc |>
  ggplot(aes(x = estimate, y = reorder(name, estimate))) +
  geom_errorbar(aes(xmin = lower_90, xmax = upper_90)) +
  geom_point(color = "red", size = 2) +
  labs(title = "Household income by county in Massachusetts",
       subtitle = "2017-2021 American Community Survey",
       y = "",
       x = "Median Income",
       caption = "ACS estimate (bars represent 90% confidence intervals)") +
  theme_minimal()
Your Turn!
- Download data on median income for another state
- Plot the income estimates for that state
15:00
Time Permitting
reactable
reactableis an R package that lets you create interactive tables- You can sort, filter, and search the table
- Based on the React Table library
- Let’s explore it together!